The baseball states graph

A state of a baseball game is a 10-tuple (s0,s1,s2,s3,j,vs,hs,tab,b,s), where

  • s0 denotes the number of outs (represented as one of the integers 0,1,2)
  • s1 is 0 if there is no runner on 1st base and 1 otherwise,
  • s2 is 0 if there is no runner on 2nd base and 1 otherwise,
  • s3 is 0 if there is no runner on 3rd base and 1 otherwise,
  • j is the inning number (represented usually as one of the integers 1, 2, . . . , 9, but it can have a larger value if the score is tied),
  • vs is the current score (number of runs) of the visiting team,
  • hs is the current score of the home team,
  • tab is the “team at bat” – 0 for visitor and 1 for home,
  • b counts the balls to the batter,
  • s counts the strikes.

For simplicity, we will always work within a given inning and omit the variables past the inning number variable. Therefore, for the remainder, regard the set of all possible states as a list of 4-tuples. These states can be listed in a 8×3 array:

(0,0,0,0), (1,0,0,0), (2,0,0,0),
(0,1,0,0), (1,1,0,0), (2,1,0,0),
(0,0,1,0), (1,0,1,0), (2,0,1,0),
(0,0,0,1), (1,0,0,1), (2,0,0,1),
(0,1,1,0), (1,1,1,0), (2,1,1,0),
(0,1,0,1), (1,1,0,1), (2,1,0,1),
(0,0,1,1), (1,0,1,1), (2,0,1,1),
(0,1,1,1), (1,1,1,1), (2,1,1,1)

Similarly, the so-called run expectancy matrix (denoted REM or RE24) is formed by examining the 24 states of a baseball game and entering the number of expected runs into each state. (This matrix depends on the year the games were played and on the ballpark. Interactive RE24 visualizations and downloadable datasets can be found on the FanGraphs website, https://blogs.fangraphs.com/introducing-the-batter-specific-run-expectancy-tool/ .) We are only looking at the states here.

There are often several ways to transition from one state to another. For example, the transition (0,0,0,0) -> (0,0,0,1) could be from a (triple) hit by the batter followed by running the bases to 3rd base. In the reverse order, the transition (0,1,1,1) -> (0,0,0,0) is also possible, when the batter hits a (grand slam) homerun. We list (most of) the possible transitions below. Omitted are the “self-transitions”, such as (1) (0,0,0,0) -> (0,0,0,0) when the batter hits a homerun, or (2) (0,1,0,0) -> (0,1,0,0) when the batter hits a single but gets an RBI from the runner on 1st base advancing all the way home. (Question: These self-transitions yield loops in the associated graph but should they be allowed for wider applications?) As indicated above, we also omit transitioning to the next inning (3 outs).

Transitions from (0,0,0,0): (0,1,0,0), (0,0,1,0), (0,0,0,1), (1,0,0,0).
Transitions from (0,1,0,0): (0,0,0,0), (0,0,1,0), (0,0,0,1), (0,1,1,0),  (0,1,0,1),  (0,0,1,1), (1,1,0,0), (1,0,1,0), (1,0,0,1), (2,0,0,0).
Transitions from (0,0,1,0): (0,0,0,0), (0,1,0,0), (0,0,0,1), (0,1,1,0),  (0,1,0,1),  (0,0,1,1), (1,1,0,0), (1,0,1,0), (1,0,0,1), (2,0,0,0).
Transitions from (0,0,0,1): (0,0,0,0), (0,1,0,0), (0,0,1,0), (0,1,0,1),  (0,0,1,1), (1,1,0,0), (1,0,1,0), (1,0,0,1), (2,0,0,0).
Transitions from (0,1,1,0): (0,0,0,0),  (0,1,0,0), (0,0,1,0), (0,0,0,1), (0,1,0,1), (0,0,1,1), (0,1,1,1), (1,1,0,0), (1,0,1,0), (1,0,0,1), (1,1,1,0), (1,1,0,1), (1,0,1,1), (2,0,0,0), (2,1,0,0), (2,0,1,0), (2,0,0,1).
Transitions from (0,1,0,1): (0,0,0,0), (0,1,0,0), (0,0,1,0), (0,0,0,1), (0,1,1,0), (0,0,1,1), (0,1,1,1), (1,1,0,0), (1,0,1,0), (1,0,0,1), (1,1,1,0), (1,1,0,1), (1,0,1,1), (2,0,0,0), (2,1,0,0), (2,0,1,0), (2,0,0,1).
Transitions from (0,0,1,1): (0,0,0,0), (0,1,0,0), (0,0,1,0), (0,0,0,1), (0,1,1,0), (0,1,0,1), (0,1,1,1), (1,1,0,0), (1,0,1,0), (1,0,0,1), (1,1,1,0), (1,1,0,1), (1,0,1,1), (2,0,0,0), (2,1,0,0), (2,0,1,0), (2,0,0,1).
Transitions from (0,1,1,1): (0,0,0,0), (0,1,0,0), (0,0,1,0), (0,0,0,1),  (0,1,1,0), (0,1,0,1), (0,0,1,1), (1,1,0,0), (1,0,1,0), (1,0,0,1), (1,1,1,0), (1,1,0,1), (1,0,1,1), (2,0,0,0), (2,1,0,0), (2,0,1,0), (2,0,0,1), (2,1,1,0), (2,1,0,1), (2,0,1,1).

Transitions from (1,0,0,0): (1,1,0,0), (1,0,1,0), (1,0,0,1), (2,0,0,0).
Transitions from (1,1,0,0): (1,0,0,0), (1,0,1,0), (1,0,0,1), (1,1,1,0), (1,1,0,1),  (1,0,1,1), (2,0,0,0), (2,1,0,0), (2,0,1,0), (2,0,0,1).
Transitions from (1,0,1,0): (1,0,0,0), (1,1,0,0), (1,0,0,1), (1,1,1,0), (1,1,0,1),  (1,0,1,1), (2,0,0,0), (2,1,0,0), (2,0,1,0), (2,0,0,1).
Transitions from (1,0,0,1): (1,0,0,0), (1,1,0,0), (1,0,1,0), (1,1,0,1), (1,0,1,1), (2,0,0,0), (2,1,0,0), (2,0,1,0), (2,0,0,1).
Transitions from (1,1,1,0): (1,0,0,0), (1,1,0,0), (1,0,1,0), (1,0,0,1), (1,1,0,1), (1,0,1,1), (1,1,1,1), (2,0,0,0), (2,1,0,0), (2,0,1,0), (2,0,0,1), (2,1,1,0), (2,1,0,1), (2,0,1,1).
Transitions from (1,1,0,1): (1,0,0,0), (1,1,0,0), (1,0,1,0), (1,0,0,1), (1,1,1,0), (1,0,1,1), (1,1,1,1), (2,0,0,0), (2,1,0,0), (2,0,1,0), (2,0,0,1), (2,1,1,0), (2,1,0,1), (2,0,1,1).
Transitions from (1,0,1,1): (1,0,0,0), (1,1,0,0), (1,0,1,0), (1,0,0,1), (1,1,0,1), (1,1,0,1), (1,1,1,1), (2,0,0,0), (2,1,0,0), (2,0,1,0), (2,0,0,1), (2,1,1,0), (2,1,0,1), (2,0,1,1).
Transitions from (1,1,1,1): (1,0,0,0), (1,1,0,0), (1,0,1,0), (1,0,0,1), (1,1,1,0), (1,1,0,1), (1,0,1,1), (2,0,0,0), (2,1,0,0), (2,0,1,0), (2,0,0,1), (2,1,1,0), (2,1,0,1), (2,0,1,1), (2,1,1,1).

Transitions from (2,0,0,0): (2,1,0,0), (2,0,1,0), (2,0,0,1).
Transitions from (2,1,0,0): (2,0,0,0), (2,0,1,0), (2,0,0,1), (2,1,1,0), (2,1,0,1), (2,0,1,1).
Transitions from (2,0,1,0): (2,0,0,0), (2,1,0,0), (2,0,0,1), (2,1,1,0), (2,1,0,1), (2,0,1,1).
Transitions from (2,0,0,1): (2,0,0,0), (2,1,0,0), (2,0,1,0), (2,1,1,0), (2,1,0,1), (2,0,1,1).
Transitions from (2,1,1,0): (2,0,0,0), (2,1,0,0), (2,0,1,0), (2,0,0,1), (2,1,0,1), (2,0,1,1), (2,1,1,1).
Transitions from (2,1,0,1): (2,0,0,0), (2,1,0,0), (2,0,1,0), (2,0,0,1), (2,1,1,0), (2,0,1,1), (2,1,1,1).
Transitions from (2,0,1,1): (2,0,0,0), (2,1,0,0), (2,0,1,0), (2,0,0,1), (2,1,1,0), (2,1,0,1), (2,1,1,1).
Transitions from (2,1,1,1): (2,0,0,0), (2,1,0,0), (2,0,1,0), (2,0,0,1), (2,1,1,0), (2,1,0,1), (2,0,1,1).

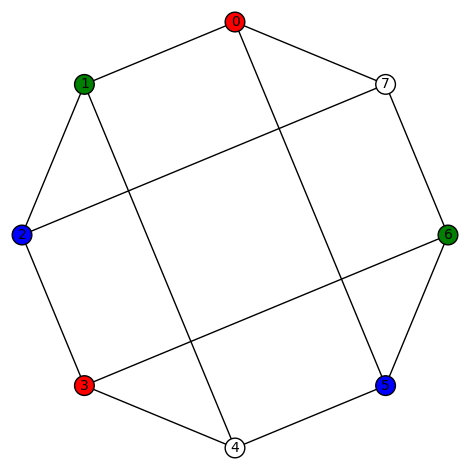
The graph with vertices being the 24 states and edges being those determined by the above neighborhoods, has 24 vertices, 182 edges, and degree of each state is given as follows: 

(0, 0, 0, 0), 8
(0, 0, 0, 1), 11
(0, 0, 1, 0), 11
(0, 0, 1, 1), 17
(0, 1, 0, 0), 11
(0, 1, 0, 1), 17
(0, 1, 1, 0), 17
(0, 1, 1, 1), 20
(1, 0, 0, 0), 9
(1, 0, 0, 1), 18
(1, 0, 1, 0), 18
(1, 0, 1, 1), 18
(1, 1, 0, 0), 18
(1, 1, 0, 1), 18
(1, 1, 1, 0), 18
(1, 1, 1, 1), 15
(2, 0, 0, 0), 22
(2, 0, 0, 1), 18
(2, 0, 1, 0), 18
(2, 0, 1, 1), 12
(2, 1, 0, 0), 18
(2, 1, 0, 1), 12
(2, 1, 1, 0), 12
(2, 1, 1, 1), 8

Note the state of maximal degree (of 22) is (2,0,0,0).

A simple trace formula for graphs

Let \Gamma=(V,E) be a simple, connected graph with vertices V={0,1,\dots, n-1} and n\times n adjacency matrix A. We start with the geometric series identity

\frac{1}{I-tA} = \sum_{\ell=0}^\infty t^\ell A^\ell,
where I=I_n is the n\times n identity matrix. Let P denote the orthonormal matrix of normalized eigenvectors, so that

PAP^{-1} = D_\Gamma, D_\Gamma = {diag}(\lambda_1,\dots,\lambda_n),
where diag(…) denotes the diagonal matrix with the given entries on the diagonal. Let the multi-set

Spec(\Gamma)={\lambda_0,\lambda_1\dots,\lambda_{n-1}}
denote the spectrum of \Gamma.

We can conjugate the above equation by P to write

\frac{1}{I-tD_\Gamma}= P\cdot [\sum_{\ell=0}^\infty t^\ell A^\ell]\cdot P^{-1}.
Taking the trace of each side gives

\sum_{j=0}^{n-1} \frac{1}{I-t\lambda_j} = \sum_{\ell=0}^\infty t^\ell tr(A^\ell).
If \Gamma has no eigenvalues equal to 0 (i.e., A is non-singular) then we may also write this as

\sum_{j=0}^{n-1} \frac{\lambda_j^{-1}}{\lambda_j^{-1}-t} = \sum_{\ell=0}^\infty t^\ell tr(A^\ell).

If we multiply both sides of the above equation by a fixed f\in C_c^\infty({\mathbb{R}})
and integrate over t in {\mathbb{R}}, we get,

\sum_{j=0}^{n-1} \lambda_j^{-1}H(f)(\lambda_j^{-1}) = {\frac{1}{\pi}}\sum_{\ell=0}^\infty tr(A^\ell) [M(f)(\ell+1)+(-1)^\ell M(f^*)(\ell+1)],
where H denotes the Hilbert transform

H(f)(z) = \frac{1}{\pi}P.V.\int_{-\infty}^\infty \frac{f(t)}{z-t}\, dt, and M is the Mellin transform

M(f)(z) = \int_{0}^\infty t^{z-1}f(t)\, dt,
and where f^* denotes the negation, f^*(t)=f(-t). Of course, if f is even then M(f)(\ell+1) = M(f^*)(\ell+1), for all \ell.

Note that tr(A^\ell) can be expressed in terms of the number of walks on the graph: If \Gamma is a connected graph and W_\ell=W_\ell(\Gamma) denotes the total number of walks of length \ell on \Gamma then

W_\ell = {\rm tr}(A^\ell)=\sum_{\lambda\in Spec(\Gamma)} \lambda^\ell.

Another mathematician visits the ballpark – WHIP

This is the second in the series of blog posts inspired by the 2004 Ken Ross book entitled A Mathematician at the Ballpark. The first one is here. In this post, again, we illustrate all these notions using the Baltimore Orioles’ 2022 season.

For an experienced baseball fan, baseball is a game of patterns. We “know” what a well-executed pitch looks like, how a double play is to be executed, how a pop-up is to be fielded, and so on. Because of these expected patterns, we know the plays which should emerge and so the desire to track their occurrences should come as no surprise. It’s been done since professional baseball started in the 1870s.
This week we discuss a pitching statistic you see on televised games, WHIP. WHIP is short for “walks plus hits allowed per innings pitched”.

Earned run average

We start off with the most basic pitching statistic, the Earned Run Average or ERA. This is the number of earned runs per 9 innings pitched:

ERA = 9·ER/IP,

where 

  • IP, the number of Innings Pitched,
  • ER, the number of Earned Runs allowed by the pitcher. That is, it counts the number of runs enabled by the offensive team’s production in the face of competent play from the defensive team.

It is possible to have ERA = ∞, since innings are measured by the number of outs achieved (so if the pitcher doesn’t get any batters out, his IP=0). The lower the ERA the better the pitcher. In the 2022 season, right-handed Félix Bautista, who entered late innings as either a closer or a reliever, had an ERA of 2.19. Left-handed closer Cionel Pérez had an ERA of 1.40.

WHIP

We define walks plus hits allowed per innings pitched by:

WHIP = (BB+H)/IP,

where (as in the previous post) BB is the number of walks and H stands for the number of Hits allowed by the pitcher (so, for example, reaching base due to a fielding error doesn’t count). WHIP reflects a pitcher’s propensity for allowing batters to reach base, therefore a lower WHIP indicates better performance.

When we plot the ERA vs the WHIP for the top 20 Orioles pitchers in 2022, we get 

Again, the line shown is the line that best fits the data. As the line of best fit doesn’t fit the date too well, this tells us that these two statistical measurements aren’t too well-correlated. In other words, low ERA indicates a good pitcher and low WHIP indicates a good pitcher, but the values for “average” pitchers seem less related to each other.

Another mathematician visits the ballpark – OPS

Yes, I more-or-less stole the above title from the 2004 Ken Ross book entitled A Mathematician at the Ballpark. Like that book, anyone familiar with middle-school (or junior high school) math, should have no problem with most of what we do here. However, I will try to go into baseball in more detail than the book did.

Paraphrasing slightly, I read somewhere the following facetious remark:

From a survey of 1000 random baseball fans 

across the nation,  183% of them hate math. 

If you are one of these 183%, then this series could be for you. Hopefully, even if you aren’t a baseball expert, but you would like to learn some baseball statistics, (now often called “sabermetrics”), these posts will help. I’m no expert myself, so we’ll learn together.

In this series of blog posts, each post will introduce a particular metric in baseball statistics as well as some of the math and baseball behind it. We illustrate all these notions using the Baltimore Orioles’ 2022 season.

This week we look at one of the most popular statistics you see on televised games: OPS or “On-base Plus Slugging,” which is short for on-base percentage plus slugging percentage. Don’t worry, we’ll explain all these terms as we go. 

On-base percentage

First, On-Base Percentage or OBP is a more recent version of On-Base Average or OBA (the same as OBP but the SF term is omitted). We define 

OBP = (H + BB + HBP)/(AB + BB + HBP + SF), 

where 

  • H is the number of Hits (the times the batter reaches base because of a batted, fair ball without error by the defense), 
  • BB is the number of Base-on-Balls (or walks), where a batter receives four pitches that the umpire calls balls, and is in turn awarded first base,
  • HBP, or Hit By Pitch, counts the times this hitter is touched by a pitch and awarded first base as a result, and 
  • SF is the number of Sacrifice Flies and AB the number of At-Bats, which are more complicated to carefully define.

The official scorer keeps track of all these numbers, and more, as the baseball game is played. We still have to define the expressions AB and SF.

First, SF, or Sacrifice Flies, counts the number of fly balls hit to the outfield for which both of the following are true:

  • this fly is caught for an out, and a baserunner scores after the catch (so there must be at most one hit at the time),
  • the fly is dropped, and a runner scores, if in the scorer’s judgment the runner could have scored after the catch had the fly ball been caught.

A sacrifice fly is only credited if a runner scores on the play. (By the way, this is a “recent” statistic, as they weren’t tabulated before 1954. Between 1876, when the major league baseball national league was born, and 1954 baseball analysts used the OBA instead.)

Second, AB, or At-Bats, counts those plate appearances that are not one of the following:

  • A walk,
  • being hit by a pitch,
  • a bunt (or Sacrifice Hit, SH),
  • a sacrifice fly,
  • interference (the catcher hitting the bat with his glove, for example), or
  • an obstruction (by the first baseman blocking the base path, for example).

Incidentally, the self-explanatory number Plate Appearances, or PA, can differ from AB by as much as 10%, mostly due to the number of walks that a batter can draw.

The main terms in the OBP expression are H and AB. So we naturally expect OBP to be approximately equal to the Batting Average, defined by

BA = H/AB,

For example, if we take the top 18 Orioles players and plot the BA vs the OBP, we get the following graph:

The line shown above is simply the line of best fit to visually indicate the correlation.

Example: As an example, let’s look at the Orioles’ All-Star center fielder,  Curtis Mullins, who had 672 plate appearances and 608 at bats, for a difference of 672 − 608 = 64. He had 1 bunt, 5 sacrifice flies, he was hit by a pitch 9 times, and walked 47 times. These add up to 62, so (using the above definition of AB) the number of times he was awarded 1st base due to interference or obstruction was 64 − 62 = 2.

Mullins’ H = 157 hits break down into 105 singles, 32 doubles, 4 triples, and 16 home runs.

Second, let’s add to these his 126 strikeouts, for a total of 157+126+64 = 347.

The remaining 608 − 347 = 261 plate appearances were pitches hit by Mullins, but either caught on the fly but a fielder or the ball landed fair and Mullins was thrown out at a base.

These account for all of Mullins’ plate appearances. Mullins has a batting average of BA = 157/608 = 0.258 and an on-base percentage of OBP = 0.318.

Slugging percentage

The slugging percentage, SLG, (SLuGging) is the total bases achieved on hits divided by at-bats:

SLG = TB/AB.

Here, TB or Total Bases, is the weighted sum

TB = 1B + 2*2B + 3*3B + 4*HR,

where

  • 1B is the number of “singles” (hits where the batter makes it to 1st Base),
  • 2B is the number of doubles,
  • 3B is the number of triples, and
  • HR denotes the number of Home Runs.

On-base Plus Slugging

With all these definitions under own belt, finally we are ready to compute “on-base plus slugging”, that is the on-base percentage plus slugging percentage:

OPS = OBP + SLG.

Example: Again, let’s consider Curtis Mullins. He had 1B = 105 singles, 2B = 32 doubles, 3B = 4 triples, and HR = 16 home runs, so his TB = 105+64+12+64 = 245. Therefore, his SLG = 245/608 = 0.403, so his on-base plus slugging is OPS = OBP + SLG = 0.318 + 0.403 = 0.721.

This finishes our discussion of OPS. I hope this helps explain it better. For more, see the OPS page at the MLB site or the wikipedia page for OPS

Harmonic quotients of regular graphs – examples

Caroline Melles and I have written a preprint that collects numerous examples of harmonic quotient morphisms \phi : \Gamma_2 \to \Gamma_1, where \Gamma_1=\Gamma_2/G is a quotient graph obtained from some subgroup G \subset Aut(\Gamma_2). The examples are for graphs having a small number of vertices (no more than 12). For the most part, we also focused on regular graphs with small degree (no more than 5). They were all computed using SageMath and a module of special purpose Python functions I’ve written (available on request). I’ve not counted, but the number of examples is relatively large, maybe over one hundred.

I’ll post it to the math arxiv at some point but if you are interested now, here’s a copy: click here for pdf.

A graph_id function in SageMath

While GAP has a group_id function which locates a “small” group in a small groups database (see the SageMath page or the GAP page for more info), AFAIK, SageMath doesn’t have something similar. I’ve written one (see below) based on the mountain of hard work done years ago by Emily Kirkman.

def graph_id_graph6(Gamma, verbose=False):
    """
    Returns the graph6 id of Gamma = (V,E).
    If verbose then it also displays the table of all graphs with
    |V| vertices and |E| edges.

    Assumes Gamma is a "small" graph.

    EXAMPLES:
    sage: Gamma = graphs.HouseGraph()
    sage: graph_id_graph6(Gamma, verbose=False)
    'Dbk'
    sage: graph_id_graph6(Gamma, verbose=True)

     graphs with 5 vertices and 6 edges:

    Graph6               Aut Grp Size         Degree Sequence     
    ------------------------------------------------------------
    DB{                  2                    [1, 2, 2, 3, 4]     
    DFw                  12                   [2, 2, 2, 3, 3]     
    DJ[                  24                   [0, 3, 3, 3, 3]     
    DJk                  2                    [1, 2, 3, 3, 3]     
    DK{                  8                    [2, 2, 2, 2, 4]     
    Dbk                  2                    [2, 2, 2, 3, 3]     


    'Dbk'

"""
n = len(Gamma.vertices())
m = len(Gamma.edges())
ds = Gamma.degree_sequence()
Q = GraphQuery(display_cols=['graph6', 'aut_grp_size', 'degree_sequence'], num_edges=['=', m], num_vertices=["=", n])
for g in Q:
    if g.is_isomorphic(Gamma):
        if verbose:
            print("\n graphs with %s vertices"%n+" and %s edges:\n"%m)
            Q.show()
            print("\n")
        return g.graph6_string()

Rankine’s “The Mathematician in Love”

The 1874 poem “The Mathematician in Love” by Scottish mechanical engineer William Rankine (in the book From Songs and Fables) has been published in many places (e.g., poetry.com, New Scientist and the scanned version is available at the internet archive. However, the mathematical equations Rankine presented at the end of his poem are only available in the scanned versions. As WordPress can render LaTeX, the poem quoted below includes those last few lines.

The Mathematician in Love
William J. M. Rankine

I.

A mathematician fell madly in love
With a lady, young, handsome, and charming:
By angles and ratios harmonic he strove
Her curves and proportions all faultless to prove,
As he scrawled hieroglyphics alarming.

II.

He measured with care, from the ends of a base.
The arcs which her features subtended:
Then he framed transcendental equations, to trace
The flowing outlines of her figure and face.
And thought the result very splendid.

III.

He studied (since music has charms for the fair)
The theory of fiddles and whistles, —
Then composed, by acoustic equations, an air,
Which, when ’twas performed, made the lady’s long hair
Stand on end, like a porcupine’s bristles.

IV.

The lady loved dancing: – he therefore applied.
To the polka and waltz, an equation;
But when to rotate on his axis he tried.
His centre of gravity swayed to one side.
And he fell, by the earth’s gravitation.

V.

No doubts of the fate of his suit made him pause.
For he proved, to his own satisfaction.
That the fair one returned his affection; – “because,
As every one knows, by mechanical laws,
Re-action is equal to action.”

VI.

“Let x denote beauty, – y manners well-bred, –
x, Fortune, – (this last is essential), –
Let L stand for love” – our philosopher said, –
“Then z is a function of x, y and 0,
Of the kind which is known as potential.”

VII.

“Now integrate L with respect to dt,
(t Standing for time and persuasion);
Then, between proper limits, ’tis easy to see,
The definite integral Marriage must be: —
(A very concise demonstration).”

VIII.

Said he – “If the wandering course of the moon
By Algebra can be predicted,
The female affections must yield to it soon” –
But the lady ran off with a dashing dragoon,
And left him amazed and afflicted.

End notes:
Equation referred to in Stanza VI.–
L=\phi(x,y,z)= \int\int\int \frac{f(x,y,z)}{\sqrt{(x-\xi)^2+(y-\nu)^2+(z-\zeta)^2}} \, d\xi d\nu d\zeta
Equation referred to in Stanza VII.–
\int_{-\infty}^\infty L\, dt = M

Let’s do the Landau shuffle

Here’s a shuffle I’ve not seen before:

  1. Take an ordinary deck of 52 cards and place them, face up, in the following pattern:
    Going from the top of the deck to the bottom, placing cards down left-to-right, put 13 cards in the top row:
    \Box\ \Box\ \Box\ \Box\ \Box\ \Box\ \Box\ \Box\ \Box\ \Box\ \Box\ \Box\ \Box\
    11 cards in the next row:
    \Box\ \Box\ \Box\ \Box\ \Box\ \Box\ \Box\ \Box\ \Box\ \Box\ \Box\
    then 9 cards in the next row:
    \Box\ \Box\ \Box\ \Box\ \Box\ \Box\ \Box\ \Box\ \Box\
    then 7 cards in the next row:
    \Box\ \Box\ \Box\ \Box\ \Box\ \Box\ \Box\
    then 5 cards in the next row:
    \Box\ \Box\ \Box\ \Box\ \Box\
    then 3 cards in the next row:
    \Box\ \Box\ \Box\
    and finally, the remaining 4 cards in the last row:
    \Box\ \Box\ \Box\ \Box\
  2. Now, take the left-most card in each row and move it to the right of the others (effectively, this is a cyclic shift of that row of cards to the left).
  3. Finally, reassemble the deck by reversing the order of the placement.

In memory of the great German mathematician Edmund Landau (1877-1938, see also this bio), I call this the Landau shuffle. As with any card shuffle, this shuffle permutes the original ordering of the cards. To restore the deck to it’s original ordering you must perform this shuffle exactly 180180 times. (By the way, this is called the order of the shuffle.) Yes, one hundred eighty thousand, one hundred and eighty times. Moreover, no other shuffle than this Landau shuffle will require more repetitions to restore the deck. So, in some sense, the Landau shuffle is the shuffle that most effectively rearranges the cards.

Now suppose we have a deck of n (distictly labeled) cards, where n>2 is an integer. The collection of all possible shuffles, or permutations, of this deck is denoted S_n and called the symmetric group. The above discussion leads naturally to the following question(s).

Question: What is the largest possible order of a shuffle of this deck (and how do you construct it)?

This requires a tiny bit of group theory. You only need to know that any permutation of n symbols (such as the card deck above) can be decomposed into a composition or product) of disjoint cycles. To compute the order of an element g \in S_n, write that element g in disjoint cycle notation. Denote the lengths of the disjoint cycles occurring in g as k_1, k_2, \dots , k_m, where k_i>0 are integers forming a partition of n: n = k_1 + k_2 +\dots + k_m. Then the order of g is known to be given by order(g) = LCM(k_1, k_2, ...., k_m), where LCM denotes the least common multiple.

The Landau function g(n) is the function that returns the maximum possible order of an element g \in S_n. Landau introduced this function in a 1903 paper where he also proved the asymptotic relation \lim_{n\to \infty} \frac{\ln(g(n))}{\sqrt{n\ln(n)}}=1.

Example: If n=52 then note 52 = 13+11+9+7+5+3+4 and that LCM(13,11,9,77,5,3,4)=180180.

Oddly, my favorite mathematical software program SageMath does not have an implementation of the Landau function, so we end with some SageMath code.

def landau_function(n):
L = Partitions(n).list()
lcms = [lcm(P) for P in L]
return max(lcms)

Here is an example (the time is included to show this took about 2 seconds on my rather old mac laptop):

sage: time landau_function(52)
CPU times: user 1.91 s, sys: 56.1 ms, total: 1.97 s
Wall time: 1.97 s
180180

Coding Theory and Cryptography

This was once posted on my USNA webpage. Since I’ve retired, I’m going to repost it here.

Coding Theory and Cryptography:
From Enigma and Geheimschreiber to Quantum Theory

(David Joyner, ed.) Springer-Verlag, 2000.
ISBN 3-540-66336-3

Summary: These are the proceedings of the “Cryptoday” Conference on Coding Theory, Cryptography, and Number Theory held at the U. S. Naval Academy during October 25-26, 1998. This book concerns elementary and advanced aspects of coding theory and cryptography. The coding theory contributions deal mostly with algebraic coding theory. Some of these papers are expository, whereas others are the result of original research. The emphasis is on geometric Goppa codes, but there is also a paper on codes arising from combinatorial constructions. There are both, historical and mathematical papers on cryptography.
Several of the contributions on cryptography describe the work done by the British and their allies during World War II to crack the German and Japanese ciphers. Some mathematical aspects of the Enigma rotor machine and more recent research on quantum cryptography are described. Moreover, there are two papers concerned with the RSA cryptosystem and related number-theoretic issues.

Chapters

  • Reminiscences and Reflections of a Codebreaker, by Peter Hilton pdf
  • FISH and I, by W. T. Tutte pdf
  • Sturgeon, The FISH BP Never Really Caught, by Frode Weierud, pdf
  • ENIGMA and PURPLE: How the Allies Broke German and Japanese Codes During the War, by David A. Hatch pdf
  • The Geheimschreiber Secret, by Lars Ulfving, Frode Weierud pdf
  • The RSA Public Key Cryptosystem, by William P. Wardlaw pdf
  • Number Theory and Cryptography (using Maple), by John Cosgrave pdf
  • A Talk on Quantum Cryptography or How Alice Outwits Eve, by Samuel J. Lomonaco, Jr. pdf
  • The Rigidity Theorems of Hamada and Ohmori, Revisited, by T. S. Michael pdf
  • Counting Prime Divisors on Elliptic Curves and Multiplication in Finite Fields, by M. Amin Shokrollahi pdf,
  • On Cyclic MDS-Codes, by M. Amin Shokrollahi pdf
  • Computing Roots of Polynomials over Function Fields of Curves, by Shuhong Gao, M. Amin Shokrollahi pdf
  • Remarks on codes from modular curves: MAPLE applications, by David Joyner and Salahoddin Shokranian, pdf

For more cryptologic history, see the National Cryptologic Museum.


This is now out of print and will not be reprinted (as far as I know). The above pdf files are posted by written permission. I thank Springer-Verlag for this.