Acknowledgement: This could not have been written without the helpful conversations and correspondences with these brilliant scholars: Edray Goins (Pomoma), John Stigall (Howard), Nathan Alexander (Howard), and Susan Kelly (Univ Wisconsin, retired). Also, I thank the librarians at the Catholic University of America for their help. I’m deeply indebted to them for sharing their knowledge about Haynes’ life and work and philosophy, but if there are mistakes, and I’m sure there are, they are my responsibility alone.
This is a non-technical (I promise!) introduction to the life and work of Euphemia Haynes. She’s a fascinating character known not just for her pure mathematics PhD thesis earned at the age of 53, but for her extraordinary devotion to improving mathematics education for everyone, as well as her service to many charities, especially those related to the Catholic Church.
At the time, the prestigious Papal Decoration of Honor medal, the Pro Ecclesia et Pontifice, was the top award for non-clergy (in particular, all women) bestowed by the Pope. That papal recognition was given to Haynes by Pope John XXIII, when she was almost 70. In fact, hers was the only Pro Ecclesia et Pontifice medal bestowed by the Pope to anyone during his entire tenure.

This is an introduction to her life’s journey.
Upbringing
Born Martha Euphemia Lofton in Washington D.C. on September 11, 1890, Euphemia preferred using her middle name.
Her father, Dr William Lofton, was a dentist while her mother Lavinia was very active in her church and later became an elementary school teacher in the D.C. school district. According to saved correspondence, the family lived on 17th Street and attended, until Euphemia was in her 20s, St Augustine’s which was a few blocks away. Lavinia and Euphemia and Joseph were part of the church choir for many years. Indeed, Lavinia was the organist for the junior choir since Euphemia was a baby.
This familial foundation within the Catholic community likely instilled in Euphemia her values of service, justice, and community engagement.
Education
Lavinia Lofton started teaching in the DC public schools in the fall of 1901 (when Euphemia was 11, as a kindergarten assistant. She was permanently appointed teacher in the DC school system a few years later in the summer of 1903.
Inspired no doubt by her mother, Euphemia’s educational journey was marked by consistent excellence. In fact, she distinguished herself early, graduating as valedictorian from M Street High School in 1907.
Euphemia Lofton began her own teaching career in the DC elementary school system in the fall of 1909. She taught there until the summer of 1912. Then she left for Smith College, where she earned an undergraduate mathematics major (and psychology minor) in 1914. During this time, the letters from her fiance Harold Haynes discuss his plans to visit her, as well as keeping her up to date on various family and business matters in DC. Upon graduation, she immediately returned to DC and started teaching in the high school system in the fall of 1914.
She taught in the Miner Normal School and various local high schools, such as Dunbar, until 1930. At that point she began teaching at the Miner Teachers College (later assimilated with others to become the University of the District of Columbia). As an early indication of her extraordinary administrative talents, Euphemia quickly founded and established the mathematics department at Miner as well.
Marriage
In 1917 she married Harold Appo Haynes, a teacher like herself. The couple had no children. He was a childhood friend and, based on saved letters between he and Euphemia, a source of constant encouragement and strength for her. Harold had a EE degree from the University of Pennsylvania in 1910, and later earned a masters in education from the University of Chicago in 1930, and a doctorate in education from New York University in 1946.
Besides Euphemia’s promotion to teach at the college level, another significant event occurred in 1930. In that year, Euphemia obtained a Master’s degree in education from the University of Chicago (with her husband Harold).
Master’s thesis
Euphemia’s thesis was a significant piece of scholarship. In it, she discussed test validity and student assessment methods. With the goal to trace the evolution of testing in elementary and secondary school mathematics from 1900 to 1930, she focused on the main mathematics subjects arithmetic, algebra, and plane geometry. She surveyed published education literature, analyzed actual test instruments in those subjects, and summarized reports by educators and administrators on their own test development.
In the early 1900s, teachers gave a large group of students the same problem and compared how they did, without a grading key or separation into different skill metrics. In her thesis she notes that educators since those early 1900s started moving away from subjective grading to data-driven evaluation. Tests need to focus objectively on specific abilities. Tests moved from general surveys to fine-grained skill analysis. Indeed, by the 1910s–1920s, grade school tests measured discrete skills within core mathematics subjects. Testing evolved as a tool for diagnosis, curriculum evaluation, and teacher development. She also notes the progression toward standardized tests and its use for diagnosing student challenges.
In fact, after retiring from teaching she because president of the DC Board of Education (the first woman to hold that office). By that point she had grown to be an extremely gifted administrator with a single-minded focus on service to both education and her church. The timing of her presidency, following the 1954 Brown v. Board decision and amidst ongoing civil rights litigation,positioned her to directly implement and enforce desegregation and equity policies. Indeed, it was during her term as president that the track system was eliminated. (For further details, see the discussion of the 1967 Hobson v Hansen District Court case in [KSZ14]).
Volunteer service
Here we mention just a few of the many volunteer efforts Euphemia Haynes generously devoted her time to.
A common thread throughout her life was her commitment to social justice and her leadership in various Catholic organizations.
She co-founded the Catholic Interracial Council of the District of Columbia, an organization she helped establish to promote racial harmony and justice within the Church and broader community. These Catholic Interracial Councils, which united under a national umbrella in 1959-1960, were founded with the explicit aim of bridging racial divides between White and Black populations. The D.C. Council, for instance, played a vital role in coordinating Catholic participation in significant civil rights events.
Haynes also held a significant leadership position as the first vice president of the Archdiocesan Council of Catholic Women, which focused on education, social justice, and assisting immigrants. She later served as president of the local chapter of that Council.
After retiring from teaching in 1959, she didn’t stop working but served others through organizations such as
- the AAUW (American Association of University Women),
- the Committee of International Social Welfare,
- the Executive Committee of the National Social Welfare Assembly,
- the D.C. Health and Welfare Council,
- the USO,
- the Urban League,
- the NAACP, and
- the League of Women Voters,
to name a few. Her unwavering commitment to social justice was fueled by the Catholic moral imperative to combat racism.
Her involvement with the Catholic Interracial Council and her broader civil rights work exemplify how Catholic social teaching provided a moral framework for her and other social activists during the Civil Rights era. The Church’s evolving stance on racial justice provided a powerful moral authority and a network (such as the Catholic Interracial Council and the Archdiocesan Council of Catholic Women) through which individuals like Haynes could actively pursue desegregation and equality. Her life demonstrates the practical application of religious principles to pressing social issues, showcasing how faith communities were critical sites for civil rights organizing and advocacy.
PhD thesis
Haynes earned her PhD from Catholic University of America (CUA) in 1943. The thesis topic itself is quite technical, to say nothing of the methods and proofs in the thesis itself. Just to understand the setup for the problem she solved in her thesis requires, at a minimum, knowing differential calculus.
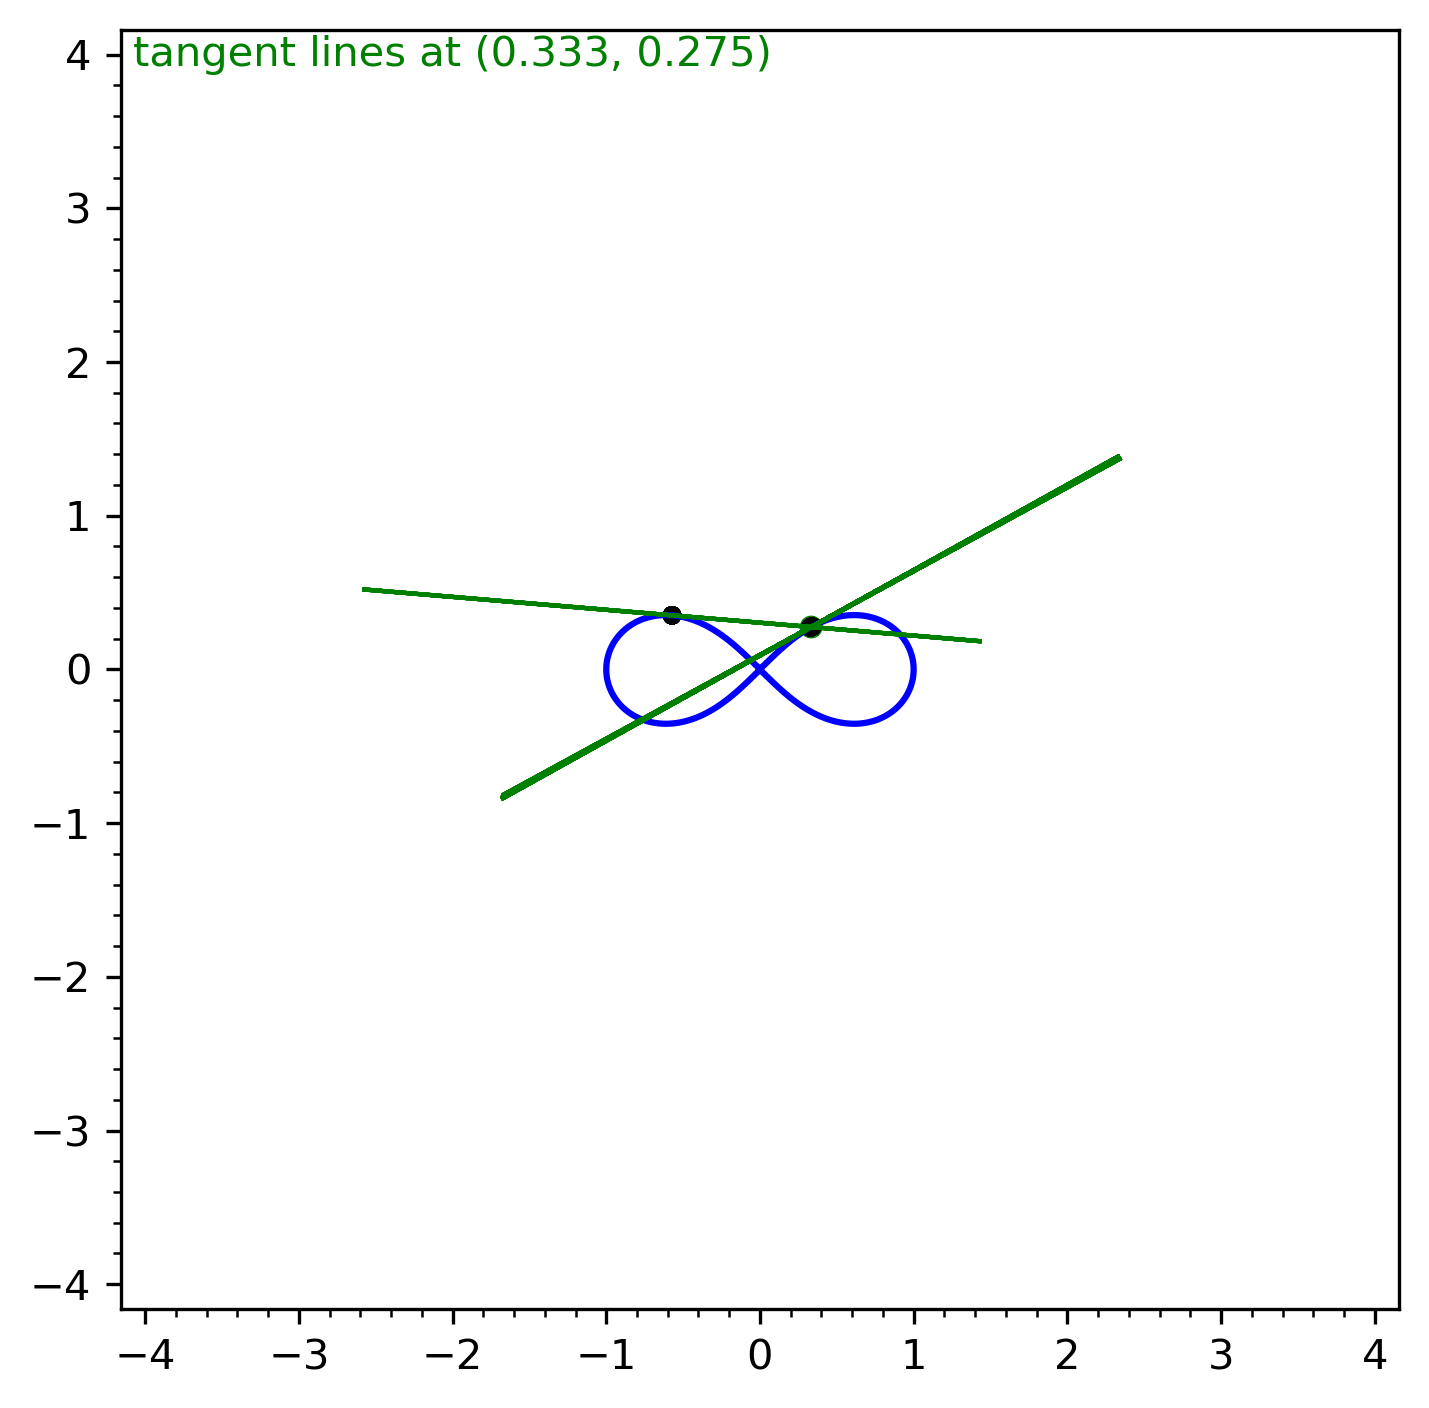
In essence, Haynes’ thesis delves into the core of enumerative geometry, a field concerned with counting geometric objects satisfying specific conditions. For example, since the time of the ancient Greeks, mathematicians have known of the Problem of Apollonius: what is the number of circles tangent to three circles in general position? (It turns out the answer is 8.) Euphemia’s problem was in a similar spirit but was of course much harder and, as pointed out, even quite technical to state. None-the-less, her work is rooted in “synthetic” methods from the 1800s emphasizing geometric constructions and reasoning without explicit reliance on algebraic calculations. One of her innovations was to make extensive use of those algebraic calculations that the synthetic method was designed to avoid! In some sense, she solved her thesis problem by first reformulating it in a more complicated mathematical framework, then she worked out the solution.
It may be worth noting that after the 1940s, the methods she used were virtually abandoned for a direct algebraic approach, using machinery borrowed from the relatively recent methods of commutative algebra. For a few more technical details are her thesis see my earlier post “Remarks on …“, also available on this blog.
By the way, she was the first Black woman to ever earn a PhD in mathematics anywhere in the United States. She never requested recognition for this achievement. Indeed, it was over 50 years later when historians of mathematics recognized it was actually her and not someone else!
Unassuming but determined, Euphemia immediately put her understanding of advanced mathematics to work, inspiring not only students in the classroom, but also teachers. In a 1945 address to a meeting of DC mathematics teachers, Euphemia spoke about the unifying nature of what she called symbolic logic. Just as the physicist studies the natural world using rocks, plants, and other physical materials, the mathematician works within the world of logic. She explained that, instead of stones or chemicals, the ”tools” of the mathematician are facts, ideas, relationships, and implications. The abstract objects of logic are the raw materials of advanced mathematics, shaping the universe in which mathematicians explore and create.
Boiled down to its essence, her message to the mathematics teachers in the audience was: Through your service, you are teaching your students to better understand the world around them.
She achieved many academic awards in her life for her service. Another kind of award was bestowed on her from the Catholic Church.
The Pro Ecclesia et Pontifice medal
Just shy of 70 years old, in 1959 Euphemia Lofton Haynes was awarded the Papal Medal, Pro Ecclesia et Pontifice, by Pope John XXIII. This recognized her “outstanding valour and bravery on behalf of the Church and Society,” as well as her extraordinary services to the Church while maintaining fidelity to God and to the Pope. This Papal Decoration of Honor was a powerful affirmation of Euphemia Haynes’s entire life — her academic, professional, and civil rights endeavors. They were expressions of her deep faith and unwavering service to humanity. It’s an appreciation from the Catholic Church for her professional accomplishments in education, including founding departments and teaching for decades, her direct, hands-on service to the community, especially to Catholic students and teachers.
Her life lesson
Euphemia Haynes showed us that mathematics is not just about numbers. For her, it’s also about perseverance, leadership, and service. She broke barriers in higher education, stood firm in her beliefs, and used her talents to uplift others. Her life is a reminder that your passion — whether in math or something else — can connect to something larger than yourself. You don’t have to choose between mathematical expertise and helping others. As Euphemia Haynes showed us, you can do both.
References
[Ha30] E. L. Haynes, The Historical Development of Tests in Elementary and Secondary Mathematics, Masters Thesis, University of Chicago, 1930. pdf: click here
[Ha43] ——, Determination of Sets of Independent Conditions Characterizing Certain Special Cases of Symmetric Correspondences, Doctoral Thesis (advisor Aubrey Landry), The Catholic University of America, Washington DC, 1943. pdf: click here
[Ha45] —-, Mathematics – symbolic logics (typewritten and hand-written notes for a talk on the nature of advanced mathematics), address to Teachers of Mathematics in Jr. and Sr. High Schools (1945), Washington DC. (Available from the collected works of Euphemia Haynes at Catholic University of America.)
[KSZ14] S. Kelly, C. Shimmers, K. Zoroufy, Euphemia Lofton Haynes: Bringing education closer to the “goal of Perfection’‘, available online at the url arxiv.org/abs/1703.00944.


— the center of gravity lies on the radius perpendicular to the junction radius;
— its distance from the axis is the third proportional to the curve’s length and the coil radius.


 and
and  . Months of computer searches resulted in a number of conjectures that were used to shape the material in the book.

 to the d-th symmetric product
  of $Y$. Its graph is denoted
  . The projection
  is a finite map of degree $d$, while the projection
  is a finite map of degree e, say. It defines a correspondence
  denoted by
  , called the inverse correspondence. Its graph
  is the image of
  under the swap
  . If d is the degree of T and e is the degree of
  .
.  be a simple, connected graph with vertices
  and
and  adjacency matrix
 is the
  denote the orthonormal matrix of normalized eigenvectors, so that
 ,
, 

 .
.![\frac{1}{I-tD_\Gamma}= P\cdot [\sum_{\ell=0}^\infty t^\ell A^\ell]\cdot P^{-1}.](https://s0.wp.com/latex.php?latex=%5Cfrac%7B1%7D%7BI-tD_%5CGamma%7D%3D+P%5Ccdot+%5B%5Csum_%7B%5Cell%3D0%7D%5E%5Cinfty+t%5E%5Cell+A%5E%5Cell%5D%5Ccdot+P%5E%7B-1%7D.&bg=ffffff&fg=323232&s=0&c=20201002)

 (i.e.,

 in
in  , we get,
![\sum_{j=0}^{n-1} \lambda_j^{-1}H(f)(\lambda_j^{-1}) = {\frac{1}{\pi}}\sum_{\ell=0}^\infty tr(A^\ell) [M(f)(\ell+1)+(-1)^\ell M(f^*)(\ell+1)],](https://s0.wp.com/latex.php?latex=%5Csum_%7Bj%3D0%7D%5E%7Bn-1%7D+%5Clambda_j%5E%7B-1%7DH%28f%29%28%5Clambda_j%5E%7B-1%7D%29+%3D+%7B%5Cfrac%7B1%7D%7B%5Cpi%7D%7D%5Csum_%7B%5Cell%3D0%7D%5E%5Cinfty+tr%28A%5E%5Cell%29+%5BM%28f%29%28%5Cell%2B1%29%2B%28-1%29%5E%5Cell+M%28f%5E%2A%29%28%5Cell%2B1%29%5D%2C&bg=ffffff&fg=323232&s=0&c=20201002)
 denotes the Hilbert transform
 and
and 
 denotes the negation,
  . Of course, if
  is even then
  , for all
  can be expressed in terms of the number of walks on the graph: If
  denotes the total number of walks of length


You must be logged in to post a comment.